Welcome to the iSEE-verse!
iSEE (interactive SummarizedExperiment Explorer) is an award-winning free open source R/Bioconductor package that produces an interactive, multi-purpose, and thoroughly configurable user interface for exploring data and metadata produced from virtually any biological assay.
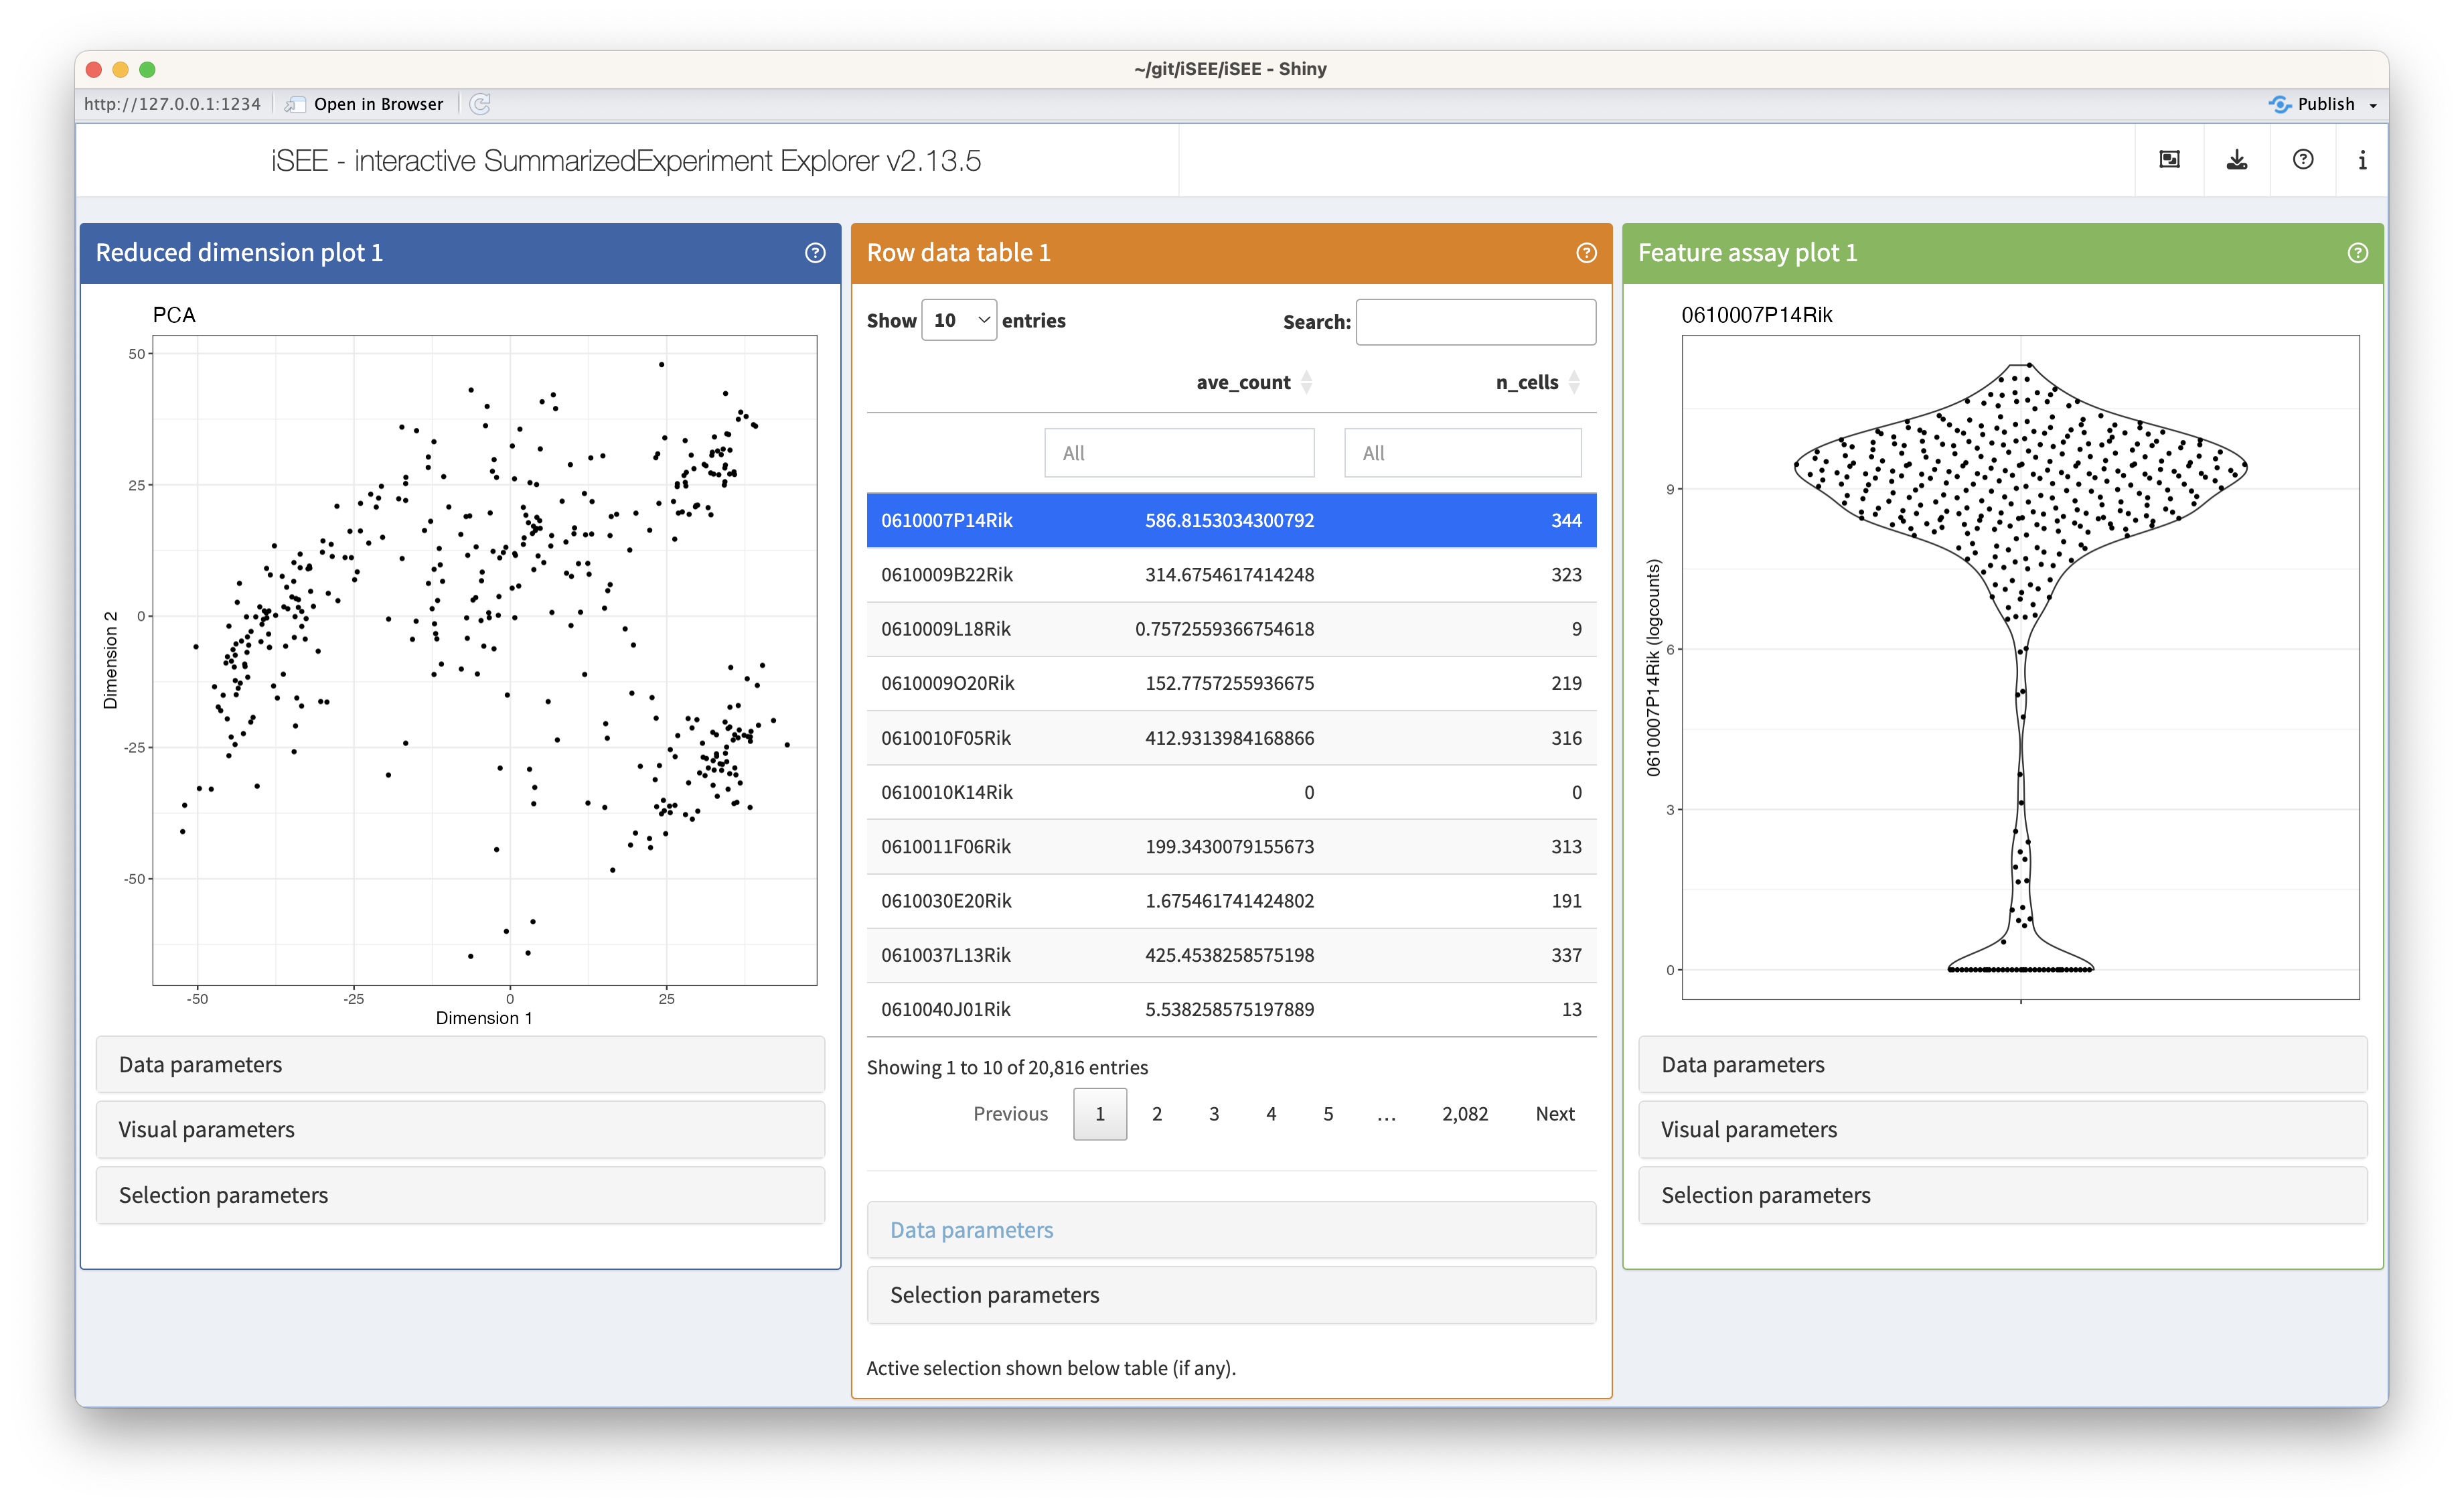
Based on the Bioconductor SummarizedExperiment data structure, iSEE directly integrates in existing workflows. The main function iSEE() only requires a SummarizedExperiment object to launch a full-featured Shiny application, either locally for immediate exploration, or publicly for global dissemination.
A clear single-page layout allows end-users to intuitively (re-)arrange any number of panels showcasing different aspects of the data set, dynamically control the displayed information using a comprehensive set of panel-specific widgets, and transmit selections between panels to focus downstream analyses on specific data subsets.
iSEE boasts a code tracker reporting the R code necessary for reproducing all visible panel outputs and restoring the current app configuration at a later time.
iSEE version 2.0.0 unlocked the possibility of developing independent third-party extension packages to add new designated classes of panels to the iSEE interface, with examples including iSEEindex, iSEEde, iSEEpathways, iSEEhex, and iSEEtree.
iSEE is actively maintained by a team of volunteers and aims to develop extensions for the support of spatial omics and multi-omics data sets in the near future.